WeRateDogs & Twitter
Assessing Data: I looked for any duplicated tweets to make sure there were none. I checked on the rating denominator for ratingDogsDF had values in it. For the image predicting set, I looked at making sure the values had consistent syntax. I created a new data frame from tweepy and made sure that it was constructed correctly.
Cleaning Data: I assessed 8 quality issues and 2 tidiness issues. For rating DogsDF, I made sure all the names in the “name” columns were actually names and changed the dtypes for the timestamps into the timestamp dtype, as well as changing the dtype of rating_numerator and rating_denominator to float. I also changed all “None” variables in the dataframe to np.nan in order to get null variables where appropriate. I dropped retweets (the row and the column) and a few other columns I knew I wouldn’t want to analyze, and concatenated the doggo, floofer, pupper, and puppo columns together to create a tidy dataframe. For image_predict, I got rid of the non-existent dog breeds in columns “p1”, “p2”, and “p3. I also made sure to standardize syntax for the remaining breed names. I also made sure to get rid of any jpg_urls that were incomplete as this dataset could be useful to pull images from, and I wanted consistent syntax. I left all the columns for potential analysis.
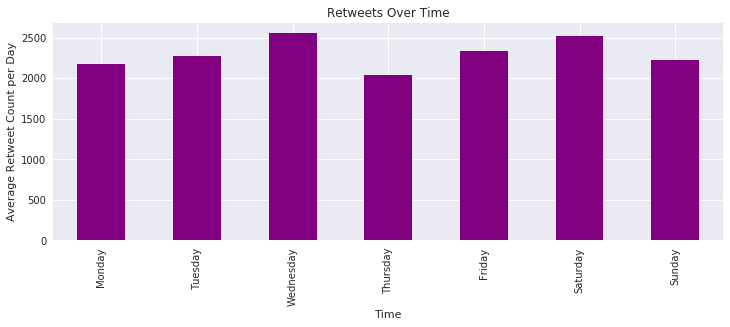
For all of the dataframes, I made sure that tweet_ids were strings as they are qualitative and not quantitative variables. Lastly, I merged the data frames together based on the shared tweet_ids.Analyzing and Visualizing Data: I loaded in the master data frame after cleaning the data and got a look at the overall information of that dataframe. I decided to look more at the retweet data added from the tweepy dataframe. First, I checked to see if any of the tweets had no retweets. Then I looked at the relationship between retweets and favorites as well as the relationship between whether a dog was named or not and if rating and time showed any correlation with retweets. For my main visualization, I looked at retweets over weekdays. In order to make my act_report more engaging, I included a bar chart of the now merged “dog_stages”.
Relationship between retweets and favorites: 95% of all tweets have more than double the amount of favorites than retweets.
Relationship between retweets and dog names: 38% of all tweets that had a dog’s name in it are retweeted.
Relationship between retweets and rating: 79% of all retweets have a rating equal to or higher than a 100% rating.