Western Africa: GDP from 1975-2015

The dataset we are working with is labeled “income” under Gapminder’s downloadable data section. (Click here for access.) “Income” is based on GDP per capita taking into account Purchasing Power based on 2011 international dollars. It covers 194 countries from the years 1799 to 2039. This dataset is compiled from a few different sources the most influential being the Maddison Project Database for their computations and also the records they held onto from the Penn World Table. Clearly, the information from 2020 onward is based on predictive modeling. Specifically, a 2% increase in GDP globally.
We will be looking at the West African region from 1975 (when the last country in the region gained independence) to 2015. This discussion will center around West African trends versus global trends as well as a look at specific countries in the region to see if there are any outliers over this forty-one year period.
When comparing the means and medians of both groups over the decade, there is a sustained positive difference between the actual average and the center of the data. This difference is larger with the global set than with the West African set, which may indicate a more normal distribution for the West African region.
As you can see from the graphs, throughout these 41 year period, there was an increase in income. The global data skews to the right more than the West African set indicating that its range is greater than the West African dataframe. The West African data is still skewed to the right, but its variance isn’t as great as the global dataframe.
Both histograms show an increase in GDP per capita when controlling for purchasing power parity over time. This increase appears more dramatic on the global set.
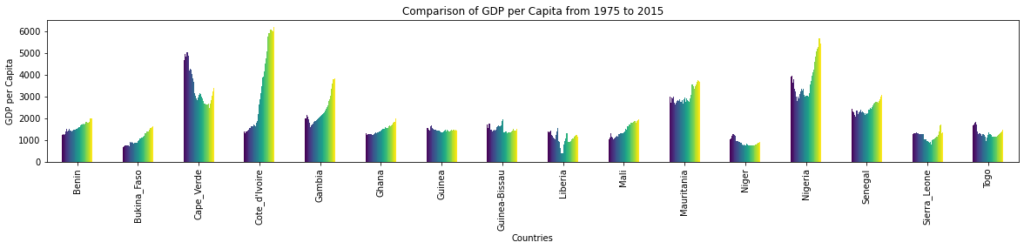
Research Question 2: Are there any outliers within the West African dataset that could use further exploration?
From this graph, we can see that there are a few countries that could use some more investigation. Specifically, Cape Verde, Cote d’Ivoire, and Nigeria appear to have significant economic activity per capita. All but Cape Verde show a recent increase in income in 2015. There are a few other countries showing that same positive correlation between time and GDP as well but none increasing past 4,000.00. There are a few where time and GDP does not correlate positively, such as Niger and Liberia.
The global dataset is skewed more to the right, showing a greater range of GDP per capita than the West African set. This can also be noted in the difference between the median and the mean from 1975:2015. The global set shows a larger range of GDP from 312 to 998,000 in international dollars. Meanwhile, the West African set is closer in range: 389 to 62100. None of the countries in this set increase past 6,300 in 2011 international dollars. This shows that West Africa is a smaller set of the global data set and does not follow the same trend lines as the global set does.
When looking at the countries in the West African region, we can see there tends to be a positive correlation between time and GDP per capita. There are a few countries where this is not the case, such as Niger and Liberia. There are also outliers in terms of GDP per capita where both Cape Verde and Cote d’Ivoire seem to be doing very well when compared to their counterparts.
Limitations:
The problems with the dataset are that it only looks at GPD per capita compared to time so its usefulness is limited until combined with other information. Also, some of the information is extrapolated and not necessarily an accurate reflection of realworld circumstances.